Sunuyu indir
Sunum yükleniyor. Lütfen bekleyiniz

1
Uz. Dr. Ömer MÜSLÜMANOĞLU

3
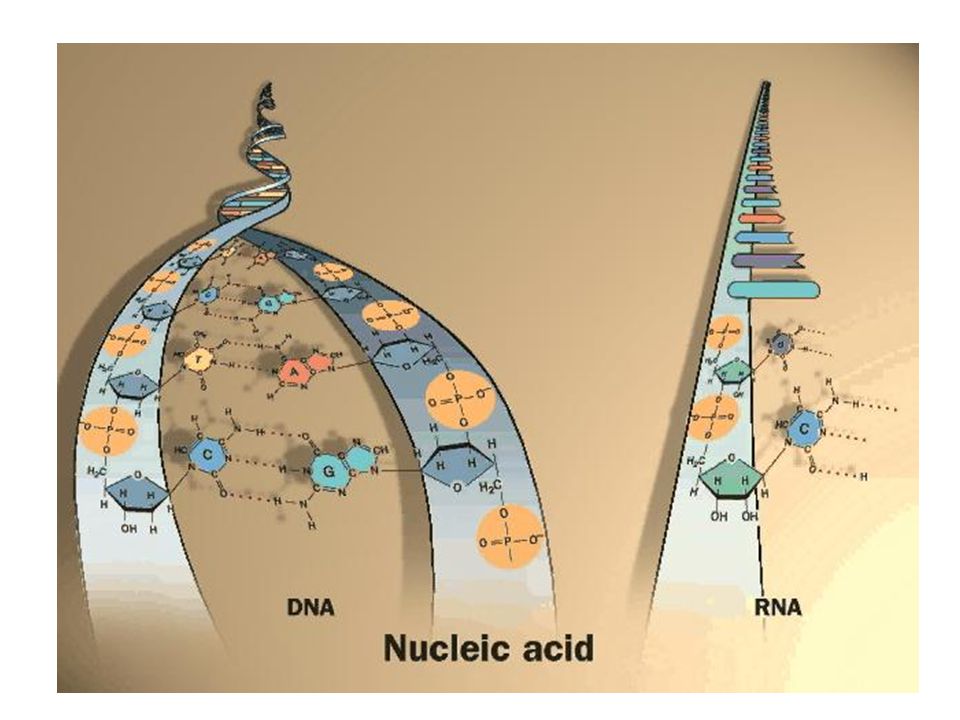
DNA Yapıtaşı

4
Bazlar

5
Bazlar

6
Şekerler

7
DNA-RNA arasında temel farklar
Şeker deoksiriboz riboz Baz çifti Timin-Adenin Sitozin-Guanin Urasil-Adenin Yapısı Çift sarmal a heliks Tek Sarmal Düzensiz Dayanıklılık Stabil DNAse ile yıkılır Baz hidrolizine açık RNAse ile yıkılır Fonksyonu Genetik bilgiyi nukleusta saklar Genetik bilgiyi sitoplazmaya taşır

9
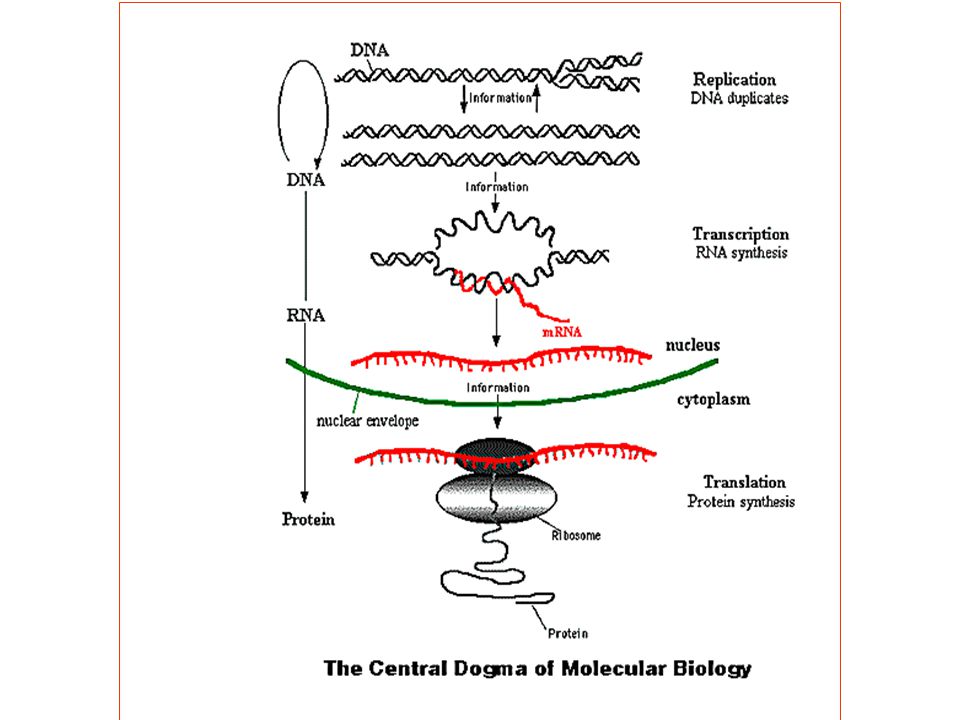
SANTRAL DOĞMA replikasyon işlenme translasyon transkripsiyon

13
DNA ISOLATION

14
Sources of Biological Evidence
Blood Semen Saliva Urine Hair Teeth Bone Tissue Blood stain Only a very small amount of blood is needed to obtain a DNA profile

15
TRANSFER aqueous (upper) phase to new tube
ORGANIC FTA Paper CHELEX Blood stain PUNCH WASH Multiple Times with extraction buffer PERFORM PCR PCR Reagents SDS, DTT, EDTA and proteinase K INCUBATE (56 oC) Phenol, chloroform, isoamyl alcohol QUANTITATE DNA Apply blood to paper and allow stain to dry VORTEX (NO DNA QUANTITATION TYPICALLY PERFORMED WITH UNIFORM SAMPLES) Water INCUBATE (ambient) 5% Chelex INCUBATE (100 oC) REMOVE supernatant Centrifuge TRANSFER aqueous (upper) phase to new tube CONCENTRATE sample (Centricon/Microcon-100 or ethanol precipitation) TE buffer Figure 3.1 Schematic of commonly used DNA extraction processes. Figure 3.1, J.M. Butler (2005) Forensic DNA Typing, 2nd Edition © 2005 Elsevier Academic Press
 Phenol, chloroform, isoamyl alcohol. QUANTITATE DNA. Apply blood to paper and allow stain to dry. VORTEX. (NO DNA QUANTITATION TYPICALLY PERFORMED WITH UNIFORM SAMPLES) Water. INCUBATE (ambient) 5% Chelex. INCUBATE (100 oC) REMOVE supernatant. Centrifuge. TRANSFER aqueous (upper) phase to new tube. CONCENTRATE sample (Centricon/Microcon-100 or ethanol precipitation) TE buffer. Figure 3.1 Schematic of commonly used DNA extraction processes. Figure 3.1, J.M. Butler (2005) Forensic DNA Typing, 2nd Edition © 2005 Elsevier Academic Press.")
16
Perpetrator’s sperm mixed with victim’s epithelial cells
Remove a portion of the mixed stain SDS, EDTA and proteinase K (cell lysis buffer) Incubate at 37 oC Centrifuge Perpetrator’s sperm mixed with victim’s epithelial cells sperm pellet REMOVE supernatant SDS, EDTA and proteinase K + DTT Figure 3.2 Schematic of differential extraction process used to separate male sperm cells from female epithelial cells. DTT lyses sperm heads “Male Fraction” sperm pellet “Female Fraction” Figure 3.2, J.M. Butler (2005) Forensic DNA Typing, 2nd Edition © 2005 Elsevier Academic Press
 Incubate at 37 oC. Centrifuge. Perpetrator’s sperm mixed with victim’s epithelial cells. sperm pellet. REMOVE supernatant. SDS, EDTA and. proteinase K + DTT. Figure 3.2 Schematic of differential extraction process used to separate male sperm cells from female epithelial cells. DTT lyses sperm heads. Male Fraction sperm pellet. Female Fraction Figure 3.2, J.M. Butler (2005) Forensic DNA Typing, 2nd Edition © 2005 Elsevier Academic Press.")
17
Differential extraction used to separate sperm (male fraction) from vaginal epithelial cells (female fraction) female Evidence (female fraction) Evidence (male fraction) male Suspect male Victim female The four samples typically associated with a forensic DNA case…
 Evidence (male fraction) male. Suspect. male. Victim. female. The four samples typically associated with a forensic DNA case…")
18
QUANTITATION

19
Calibration standards Unknown Samples
20 ng 10 ng 5 ng 2.5 ng 1.25 ng 0.63 ng Calibration standards Unknown Samples ~2.5 ng Figure 3.3 Illustration of a human DNA quantitation result with the slot blot procedure. A serial dilution of a human DNA standard is run on either side of the slot blot membrane for comparison purposes. The quantity of each of the unknown samples is estimated by visual comparison to the calibration standards. For example, the sample indicated by the arrow is closest in appearance to the 2.5 ng standard. Figure 3.3, J.M. Butler (2005) Forensic DNA Typing, 2nd Edition © 2005 Elsevier Academic Press
 Forensic DNA Typing, 2nd Edition © 2005 Elsevier Academic Press.")
20
Calculation of the quantity of DNA in a cell
1. Molecular Weight of a DNA Basepair = 618g/mol A =: 313 g/mol; T: 304 g/mol; A-T base pairs = 617 g/mol G = 329 g/mol; C: 289 g/mol; G-C base pairs = 618 g/mol 2. Molecular weight of DNA = 1.85 x10¹² g/mol There are 3 billion base pairs in a haploid cell ~3 x 10⁹ bp (~3 x 10⁹ bp) x (618 g/mol/bp) = 1.85 x 10¹² g/mol 3. Quantity of DNA in a haploid cell = 3 picograms 1 mole = 6.02 x 10²³ molecules (1.85 x 10¹² g/mol) x (1 mole/6.02 x 1023 molecules) = 3.08 x g = 3.08 picograms (pg) A diploid human cell contains ~6 pg genomic DNA 4. One ng of DNA contains the DNA from diploid cells 1 ng genomic DNA (1000 pg)/6pg/cell = ~333 copies of each locus (2 per 167 diploid genomes)
 x (618 g/mol/bp) = 1.85 x 10¹² g/mol. 3. Quantity of DNA in a haploid cell = 3 picograms. 1 mole = 6.02 x 10²³ molecules. (1.85 x 10¹² g/mol) x (1 mole/6.02 x 1023 molecules) = 3.08 x g = 3.08 picograms (pg) A diploid human cell contains ~6 pg genomic DNA. 4. One ng of DNA contains the DNA from 167 diploid cells. 1 ng genomic DNA (1000 pg)/6pg/cell = ~333 copies of each locus (2 per 167 diploid genomes)")
21
Importance of DNA Quantitation (prior to multiplex PCR)
DNA amount (log scale) High levels of DNA create interpretation challenges (more artifacts to review) 100 ng -A Too much DNA Off-scale peaks Split peaks (+/-A) Locus-to-locus imbalance +A 10 ng 2.0 ng Well-balanced STR multiplex 1 ng STR Kits Work Best in This Range 0.5 ng 0.1 ng Too little DNA Heterozygote peak imbalance Allele drop-out Locus-to-locus imbalance 0.01 ng Stochastic effect when amplifying low levels of DNA produces allele dropout
 High levels of DNA create interpretation challenges (more artifacts to review) 100 ng. -A. Too much DNA. Off-scale peaks. Split peaks (+/-A) Locus-to-locus imbalance. +A. 10 ng. 2.0 ng. Well-balanced STR multiplex. 1 ng. STR Kits Work Best in This Range. 0.5 ng. 0.1 ng. Too little DNA. Heterozygote peak imbalance. Allele drop-out. Locus-to-locus imbalance ng. Stochastic effect when amplifying low levels of DNA produces allele dropout.")
22
X Y X = 212 bp Y = 218 bp X = 106 bp Y = 112 bp AmpFlSTR kits
6 bp deletion X = 212 bp Y = 218 bp X = 106 bp Y = 112 bp AmpFlSTR kits and PowerPlex 16 PowerPlex 1.1 Figure 5.11 Schematic of the amelogenin sex-typing assay. The X and Y chromosomes contain a high degree of sequence homology at the amelogenin locus. The primer sets depicted here target a 6 bp deletion that is present only on the X chromosome. The presence of a single peak indicates that the sample comes from a female while two peaks identifies the sample’s source as male. The primers to amplify the 106/112 bp fragments are used in the AmpFlSTR kits while the PowerPlex 1.1 kit uses the larger primer set. Female: X, X 1:1 Mixture: 3X + 1Y Male: X, Y Figure 5.11, J.M. Butler (2005) Forensic DNA Typing, 2nd Edition © 2005 Elsevier Academic Press
 Forensic DNA Typing, 2nd Edition © 2005 Elsevier Academic Press.")
23
PCR

24
POLİMORFİZM Bir popülasyonda mevcut olan genetik çeşitliliğe polimorfizm denir DNA Polimorfizmi, DNA üzerinde hastalığa neden olmayan, suskun nükleotid değişimleri olarak tanımlanır.

25
(A) Sequence polymorphism
AGACTAGACATT AGATTAGGCATT (B) Length polymorphism (AATG)(AATG)(AATG) 3 repeats (AATG)(AATG) Figure 2.5 Two forms of variation in DNA: (A) sequence polymorphisms and (B) length polymorphisms. The short tandem repeat DNA markers discussed in this book are length polymorphisms. 2 repeats Figure 2.5, J.M. Butler (2005) Forensic DNA Typing, 2nd Edition © 2005 Elsevier Academic Press 25
 Length polymorphism (AATG)(AATG)(AATG) repeats (AATG)(AATG) Figure 2.5 Two forms of variation in DNA: (A) sequence polymorphisms and (B) length polymorphisms. The short tandem repeat DNA markers discussed in this book are length polymorphisms. 2 repeats. Figure 2.5, J.M. Butler (2005) Forensic DNA Typing, 2nd Edition © 2005 Elsevier Academic Press. 25.")
26
Chromosome 12 p Band 3 12p3 (short arm) centromere q (long arm) 12q5
telomere q (long arm) Band 5 Band 3 Chromosome 12 12p3 12q5 Figure 2.4 Basic chromosome structure and nomenclature. The centromere is a distinctive feature of chromosomes and plays an important role during mitosis. On either side of the centromere are “arms” that extend to terminal regions, known as telomeres. The short arm of a chromosome is designated as “p” while the long arm is referred to as “q”. The band nomenclature refers to physical staining with a Giemsa dye (G-banded). Band localization is determined by G-banding the image of a metaphase spread during cell division. Bands are numbered outward from the centromere with the largest values near the telomeres. Figure 2.4, J.M. Butler (2005) Forensic DNA Typing, 2nd Edition © 2005 Elsevier Academic Press 26
 Band 5. Band 3. Chromosome p3. 12q5. Figure 2.4 Basic chromosome structure and nomenclature. The centromere is a distinctive feature of chromosomes and plays an important role during mitosis. On either side of the centromere are arms that extend to terminal regions, known as telomeres. The short arm of a chromosome is designated as p while the long arm is referred to as q . The band nomenclature refers to physical staining with a Giemsa dye (G-banded). Band localization is determined by G-banding the image of a metaphase spread during cell division. Bands are numbered outward from the centromere with the largest values near the telomeres. Figure 2.4, J.M. Butler (2005) Forensic DNA Typing, 2nd Edition © 2005 Elsevier Academic Press. 26.")
27
İnsan Genomunda Dizi Tiplerinin Dağılımı

28
Minisatellite Marker (D1S80)
GAGGACCACCAGGAAG Repeat region Flanking regions 16 bp repeat unit STR Marker (TH01) TCAT Repeat region Flanking regions 4 bp repeat unit Figure 5.1 Schematic of minisatellite and microsatellite (STR) DNA markers. PCR primers are designed to target invariant flanking sequence regions. The number of tandem repeat units in the repeat regions varies among individuals making them useful markers for human identification. Figure 5.1, J.M. Butler (2005) Forensic DNA Typing, 2nd Edition © 2005 Elsevier Academic Press
 TCAT. Repeat region. Flanking regions. 4 bp repeat unit. Figure 5.1 Schematic of minisatellite and microsatellite (STR) DNA markers. PCR primers are designed to target invariant flanking sequence regions. The number of tandem repeat units in the repeat regions varies among individuals making them useful markers for human identification. Figure 5.1, J.M. Butler (2005) Forensic DNA Typing, 2nd Edition © 2005 Elsevier Academic Press.")
29
Homologous pair of chromosomes
6 3 4 5 Homologous pair of chromosomes Locus A Locus B Allele 1 Allele 2 Figure 2.6 Schematic representation of two different STR loci on different pairs of homologous chromosomes. The chromosomes with the open circle chromosomes are paternally inherited while the solid centromere chromosomes are maternally inherited. Thus, this individual received the four repeat allele at locus A and the three repeat allele at locus B from their father, and the five repeat allele at locus A and the six repeat allele at locus B from their mother. Figure 2.6, J.M. Butler (2005) Forensic DNA Typing, 2nd Edition © 2005 Elsevier Academic Press 29
 Forensic DNA Typing, 2nd Edition © 2005 Elsevier Academic Press. 29.")
30
5’-TTTCCC TCAT TCAT TCAT TCAT TCAT TCAT TCACCATGGA-3’
5’-TTTCCC TCAT TCAT TCAT TCAT TCAT TCAT TCACCATGGA-3’ 3’-AAAGGG AGTA AGTA AGTA AGTA AGTA AGTA AGTGGTACCT-5’ Figure 5.2 Example of the DNA sequence in a STR repeat region. Note that using the top strand versus the bottom strand results in different repeat motifs and starting positions. In this example, the top strand has 6 TCTA repeat units while the bottom strand has 6 TGAA repeat units. Under ISFH recommendations (Bar et al. 1997), the top strand from GenBank should be used. Thus, this example would be described as having [TCAT] as the repeat motif. Repeat numbering, indicated above and below the sequence, proceeds in the 5’-to-3’ direction as illustrated by the arrows. Figure 5.2, J.M. Butler (2005) Forensic DNA Typing, 2nd Edition © 2005 Elsevier Academic Press
, the top strand from GenBank should be used. Thus, this example would be described as having [TCAT] as the repeat motif. Repeat numbering, indicated above and below the sequence, proceeds in the 5’-to-3’ direction as illustrated by the arrows. Figure 5.2, J.M. Butler (2005) Forensic DNA Typing, 2nd Edition © 2005 Elsevier Academic Press.")
31
Typically 25-35 cycles performed during PCR
94 oC 60 oC 72 oC Time Temperature Single Cycle Typically cycles performed during PCR The denaturation time in the first cycle is lengthened to ~10 minutes when using AmpliTaq Gold to perform a “hot-start” PCR Figure 4.1 Thermal Cycling Temperature Profile for PCR. Thermal cycling typically involves 3 different temperatures that are repeated over and over again times. At 94 oC, the DNA strands separate, or “denature”. At 60 oC, primers bind or “anneal” to the DNA template and target the region to be amplified. At 72 oC, the DNA polymerase extends the primers by copying the target region using the deoxynucleotide triphosphate building blocks. The entire PCR process is about 3 hours in duration with each cycle taking ~5 minutes on conventional thermal cyclers: 1 minute each at 94 oC, 60 oC, and 72 oC and about 2 minutes ramping between the 3 temperatures. Figure 4.1, J.M. Butler (2005) Forensic DNA Typing, 2nd Edition © 2005 Elsevier Academic Press
 Forensic DNA Typing, 2nd Edition © 2005 Elsevier Academic Press.")
32
PCR

33
Agarose yield gel results
Degraded DNA sample D5S818 D13S317 D7S820 D16S539 CSF1PO Penta D Agarose yield gel results Smear of degraded DNA fragments High molecular weight DNA in a tight band (A) (B) Good quality DNA Degraded DNA Figure 7.1 Impact of degraded DNA on (A) agarose yield gel results and (B) STR typing. (A) Degraded DNA is broken up into small pieces that appear as a smear on a scanned yield gel compared to good quality DNA possessing intact high molecular weight DNA. (B) Signal strength is generally lost with larger size PCR products when STR typing is performed on degraded DNA, such as is shown from the green dye-labeled loci in the PowerPlex 16 kit. Thus, 180 bp D13S317 PCR products have a higher signal than 400 bp Penta D amplicons because more DNA molecules are intact in the 200 bp versus the 400 bp size range. Figure 7.1, J.M. Butler (2005) Forensic DNA Typing, 2nd Edition © 2005 Elsevier Academic Press
 (B) Good quality DNA. Degraded DNA. Figure 7.1 Impact of degraded DNA on (A) agarose yield gel results and (B) STR typing. (A) Degraded DNA is broken up into small pieces that appear as a smear on a scanned yield gel compared to good quality DNA possessing intact high molecular weight DNA. (B) Signal strength is generally lost with larger size PCR products when STR typing is performed on degraded DNA, such as is shown from the green dye-labeled loci in the PowerPlex 16 kit. Thus, 180 bp D13S317 PCR products have a higher signal than 400 bp Penta D amplicons because more DNA molecules are intact in the 200 bp versus the 400 bp size range. Figure 7.1, J.M. Butler (2005) Forensic DNA Typing, 2nd Edition © 2005 Elsevier Academic Press.")
34
miniSTRs: new tool for degraded DNA
STR repeat region miniSTR primer Conventional PCR primer (A) (B) Conventional STR test (COfiler™ kit) MiniSTR assay (using Butler et al primers) Smaller PCR products work better with low copy number or fragmented DNA templates Figure 7.2 (A) MiniSTRs, or reduced sized amplicons for STR typing, are created by designing PCR primers that anneal closer to the repeat region than conventional STR kit primers. (B) PCR product sizes, such as demonstrated here with D16S539, can be reduced by over 150 bp relative to conventional tests. MiniSTR assays can produce the same typing result as those from larger STR amplicons produced by kits often with greater success on degraded DNA samples. 150 bp smaller Figure 7.2, J.M. Butler (2005) Forensic DNA Typing, 2nd Edition © 2005 Elsevier Academic Press
 (B) Conventional STR test (COfiler™ kit) MiniSTR assay (using Butler et al primers) Smaller PCR products work better with low copy number or fragmented DNA templates. Figure 7.2 (A) MiniSTRs, or reduced sized amplicons for STR typing, are created by designing PCR primers that anneal closer to the repeat region than conventional STR kit primers. (B) PCR product sizes, such as demonstrated here with D16S539, can be reduced by over 150 bp relative to conventional tests. MiniSTR assays can produce the same typing result as those from larger STR amplicons produced by kits often with greater success on degraded DNA samples. 150 bp smaller. Figure 7.2, J.M. Butler (2005) Forensic DNA Typing, 2nd Edition © 2005 Elsevier Academic Press.")
35
Y-STR

36
(passed on complete, but only by sons)
Lineage Markers Autosomal (passed on in part, from all ancestors) Figure 9.1 Illustration of inheritance patterns from recombining autosomal genetic markers and the lineage markers from the Y-chromosome and mitochondrial DNA. Y-Chromosome (passed on complete, but only by sons) Mitochondrial (passed on complete, but only by daughters) Figure 9.1, J.M. Butler (2005) Forensic DNA Typing, 2nd Edition © 2005 Elsevier Academic Press
 Figure 9.1 Illustration of inheritance patterns from recombining autosomal genetic markers and the lineage markers from the Y-chromosome and mitochondrial DNA. Y-Chromosome. (passed on complete, but only by sons) Mitochondrial. (passed on complete, but only by daughters) Figure 9.1, J.M. Butler (2005) Forensic DNA Typing, 2nd Edition © 2005 Elsevier Academic Press.")
37
Y-Chromosome STR Profile
Female-Male Mixture Performance with Autosomal vs. Y-Chromosome DNA Markers Female Victim DNA Profile Male Perpetrator DNA Profile DNA Profile from Crime Scene Autosomal STR Profile Y-Chromosome STR Profile No signal observed Figure 9.2 Schematic illustrating the types of autosomal or Y-STR profiles that might be observed with sexual assault evidence where mixtures of high amounts of female DNA may mask the STR profile of the perpetrator. Y-STR testing permits isolation of the male component without having to perform a differential lysis. Figure 9.2, J.M. Butler (2005) Forensic DNA Typing, 2nd Edition © 2005 Elsevier Academic Press
 Forensic DNA Typing, 2nd Edition © 2005 Elsevier Academic Press.")
38
Modern Use of Y-STR Testing
Captured December 13, 2003 Uday and Qusay Hussein Killed July 22, 2003 Matching Y-STR Haplotype Used to Confirm Identity (along with allele sharing from autosomal STRs) Is this man really Sadaam Hussein? Butler, J.M. (2005) Forensic DNA Typing, 2nd Edition, Box 23.1, p. 534
 Is this man really Sadaam Hussein Butler, J.M. (2005) Forensic DNA Typing, 2nd Edition, Box 23.1, p")
39
PCR product size (bp) Figure A7.1 Profiler Plus green loci for the victim, suspect, and differential extraction female and male fractions from Case A. A mixture with a minor component consistent with the suspect is observed in the epithelial-rich (female) fraction (see third panel). Arrows indicate where stutter filters have removed allele calls. Figure A7.1, J.M. Butler (2005) Forensic DNA Typing, 2nd Edition © 2005 Elsevier Academic Press
 fraction (see third panel). Arrows indicate where stutter filters have removed allele calls. Figure A7.1, J.M. Butler (2005) Forensic DNA Typing, 2nd Edition © 2005 Elsevier Academic Press.")
40
(A) Y-PLEX 6 (FAM-labeled loci)
PCR product size (bp) Figure A7.2 (A) Y-PLEX 6 results from FAM-labeled (blue) loci on evidence, victim, and suspect samples in Case B. No PCR products were observed in the female victim sample since it does not contain a Y-chromosome. Figure A7.2, J.M. Butler (2005) Forensic DNA Typing, 2nd Edition © 2005 Elsevier Academic Press
 Figure A7.2 (A) Y-PLEX 6 results from FAM-labeled (blue) loci on evidence, victim, and suspect samples in Case B. No PCR products were observed in the female victim sample since it does not contain a Y-chromosome. Figure A7.2, J.M. Butler (2005) Forensic DNA Typing, 2nd Edition © 2005 Elsevier Academic Press.")
41
ELEKTROFOREZ

42
Elektroforez Nükleik asitler (-) yüke sahitir (PO4)
Jelde göç etmeleri büyüklükleri ve yapıları ile ilgilidir

43
Capillary filled with polymer solution
Laser Inlet Buffer Capillary filled with polymer solution 5-20 kV - + Outlet Sample tray Detection window (cathode) (anode) Data Acquisition Sample tray moves automatically beneath the cathode end of the capillary to deliver each sample in succession Figure 12.3 Schematic of capillary electrophoresis instruments used for DNA analysis. The capillary is a narrow glass tube approximately 50 cm long and 50 microns in diameter. It is filled with a viscous polymer solution that acts much like a gel in creating a sieving environment for DNA molecules. Samples are placed into a tray and injected onto the capillary by applying a voltage to each sample sequentially. A high voltage (e.g., 15,000 volts) is applied across the capillary after the injection in order to separate the DNA fragments in a matter of minutes. Fluorescent dye-labeled products are analyzed as they pass by the detection window and are excited by a laser beam. Computerized data acquisition enables rapid analysis and digital storage of separation results. Figure 12.3, J.M. Butler (2005) Forensic DNA Typing, 2nd Edition © 2005 Elsevier Academic Press
 (anode) Data Acquisition. Sample tray moves automatically beneath the cathode end of the capillary to deliver each sample in succession. Figure 12.3 Schematic of capillary electrophoresis instruments used for DNA analysis. The capillary is a narrow glass tube approximately 50 cm long and 50 microns in diameter. It is filled with a viscous polymer solution that acts much like a gel in creating a sieving environment for DNA molecules. Samples are placed into a tray and injected onto the capillary by applying a voltage to each sample sequentially. A high voltage (e.g., 15,000 volts) is applied across the capillary after the injection in order to separate the DNA fragments in a matter of minutes. Fluorescent dye-labeled products are analyzed as they pass by the detection window and are excited by a laser beam. Computerized data acquisition enables rapid analysis and digital storage of separation results. Figure 12.3, J.M. Butler (2005) Forensic DNA Typing, 2nd Edition © 2005 Elsevier Academic Press.")
44
CAPİLLER ELECTROPHORESİS

45
DNA PROFİLİ

46
The Same 13 Locus STR Profile in Different Populations
1 in 837 trillion 1 in 0.84 quadrillion (1015) in U.S. Caucasian population (NIST) 1 in 2.46 quadrillion (1015) in U.S. Caucasian population (FBI)* 1 in 1.86 quadrillion (1015) in Canadian Caucasian population* 1 in 16.6 quadrillion (1015) in African American population (NIST) 1 in 17.6 quadrillion (1015) in African American population (FBI)* 1 in 18.0 quadrillion (1015) in U.S. Hispanic population (NIST) These values are for unrelated individuals assuming no population substructure (using only p2 and 2 pq) NIST study: Butler, J.M., et al. (2003) Allele frequencies for 15 autosomal STR loci on U.S. Caucasian, African American, and Hispanic populations. J. Forensic Sci. 48(4): ( *
 in U.S. Caucasian population (NIST) 1 in 2.46 quadrillion (1015) in U.S. Caucasian population (FBI)* 1 in 1.86 quadrillion (1015) in Canadian Caucasian population* 1 in 16.6 quadrillion (1015) in African American population (NIST) 1 in 17.6 quadrillion (1015) in African American population (FBI)* 1 in 18.0 quadrillion (1015) in U.S. Hispanic population (NIST) These values are for unrelated individuals assuming no population substructure (using only p2 and 2 pq) NIST study: Butler, J.M., et al. (2003) Allele frequencies for 15 autosomal STR loci on U.S. Caucasian, African American, and Hispanic populations. J. Forensic Sci. 48(4): ( *")
47
Incomplete adenylation Biological (PCR) artifacts
Deciphering Artifacts from the True Alleles D3S1358 Stutter products 6.0% 7.8% Incomplete adenylation D8S1179 -A +A Biological (PCR) artifacts Dye blob STR alleles stutter Pull-up (bleed-through) spike Blue channel Green channel Yellow channel Red channel Figure 15.4 Hypothetical electropherogram displaying several artifacts often observed with STR typing. Figure 15.4, J.M. Butler (2005) Forensic DNA Typing, 2nd Edition © 2005 Elsevier Academic Press
 artifacts. Dye blob. STR alleles. stutter. Pull-up. (bleed-through) spike. Blue channel. Green channel. Yellow channel. Red channel. Figure 15.4 Hypothetical electropherogram displaying several artifacts often observed with STR typing. Figure 15.4, J.M. Butler (2005) Forensic DNA Typing, 2nd Edition © 2005 Elsevier Academic Press.")
48
(a) (b) Heterozygous peak region >70% <15% Stutter region
100% Heterozygous peak region 85% MIXTURE REGION 9% Higher than typical stutter product (>15%) 60% 10% 25% Wrong side of allele to be typical stutter product Smaller peak area than normally seen with heterozygote partner alleles(<70%) (a) (b) Figure 7.3 Illustration of typical single source (a) versus mixed sample (b) heterozygote peak patterns. The relative peak areas due to the measured fluorescent signal are useful indicators to decipher the presence of a sample mixture. If the highest peak at a locus is set at 100%, then heterozygous alleles should have peak areas and peak heights that are greater than 70% of the highest alleles. Stutter products are typically less than 15% of their corresponding allele peak and shorter by four base pairs for tetranucleotide repeats. Figure 7.3, J.M. Butler (2005) Forensic DNA Typing, 2nd Edition © 2005 Elsevier Academic Press
 60% 10% 25% Wrong side of allele to be typical stutter product. Smaller peak area than normally seen with heterozygote partner alleles(<70%) (a) (b) Figure 7.3 Illustration of typical single source (a) versus mixed sample (b) heterozygote peak patterns. The relative peak areas due to the measured fluorescent signal are useful indicators to decipher the presence of a sample mixture. If the highest peak at a locus is set at 100%, then heterozygous alleles should have peak areas and peak heights that are greater than 70% of the highest alleles. Stutter products are typically less than 15% of their corresponding allele peak and shorter by four base pairs for tetranucleotide repeats. Figure 7.3, J.M. Butler (2005) Forensic DNA Typing, 2nd Edition © 2005 Elsevier Academic Press.")
49
amelogenin X-Y peak imbalance
D 3 peaks at D8S1179 4 peaks at D21S11 4 peaks at D18S51 X Y DNA Size (bp) RFUs Figure 7.6 Peak areas for green panel data from example mixture in Figure Mixture ratio calculations for these STR markers are shown in Table 7.3. RFUs = relative fluorescence units. Figure 7.6, J.M. Butler (2005) Forensic DNA Typing, 2nd Edition © 2005 Elsevier Academic Press
 RFUs. Figure 7.6 Peak areas for green panel data from example mixture in Figure 7.5. Mixture ratio calculations for these STR markers are shown in Table 7.3. RFUs = relative fluorescence units. Figure 7.6, J.M. Butler (2005) Forensic DNA Typing, 2nd Edition © 2005 Elsevier Academic Press.")
50
mtDNA

51
Human Genome 23 Pairs of Chromosomes + mtDNA
Located in cell nucleus X Y Autosomes 2 copies per cell Located in mitochondria (multiple copies in cell cytoplasm) mtDNA 16,569 bp Mitochondrial DNA Figure 2.3 The human genome contained in every cell consists of 23 pairs of chromosomes and a small circular genome known as mitochondrial DNA. Chromosomes 1-22 are numbered according to their relative size and occur in single copy pairs within a cell’s nucleus with one copy being inherited from one’s mother and the other copy coming from one’s father. Sex-chromosomes are either X,Y for males or X,X for females. Mitochondrial DNA is inherited only from one’s mother and is located in the mitochondria with hundreds of copies per cell. Together the nuclear DNA material amounts to over 3 billion base pairs (bp) while mitochondrial DNA is only about 16,569 bp in length. Sex-chromosomes Nuclear DNA 3.2 billion bp 100s of copies per cell Figure 2.3, J.M. Butler (2005) Forensic DNA Typing, 2nd Edition © 2005 Elsevier Academic Press
 mtDNA. 16,569 bp. Mitochondrial DNA. Figure 2.3 The human genome contained in every cell consists of 23 pairs of chromosomes and a small circular genome known as mitochondrial DNA. Chromosomes 1-22 are numbered according to their relative size and occur in single copy pairs within a cell’s nucleus with one copy being inherited from one’s mother and the other copy coming from one’s father. Sex-chromosomes are either X,Y for males or X,X for females. Mitochondrial DNA is inherited only from one’s mother and is located in the mitochondria with hundreds of copies per cell. Together the nuclear DNA material amounts to over 3 billion base pairs (bp) while mitochondrial DNA is only about 16,569 bp in length. Sex-chromosomes. Nuclear DNA. 3.2 billion bp. 100s of copies per cell. Figure 2.3, J.M. Butler (2005) Forensic DNA Typing, 2nd Edition © 2005 Elsevier Academic Press.")
52
“16,569” bp 22 tRNAs 2 rRNAs Heavy (H) strand 13 genes
Control region (D-loop) 1/16,569 cyt b ND5 ND6 ND4 ND4L ND3 COIII ATP6 ATP8 COII 12S rRNA 16S ND1 ND2 COI OH 9-bp deletion OL F V L1 I Q M W A N C Y S1 D K G R H S2 L2 E P T HV1 HV2 16024 16365 73 340 576 “16,569” bp 1 22 tRNAs 2 rRNAs 13 genes Heavy (H) strand Light (L) strand Figure 10.1 Schematic showing the circular mitochondrial DNA genome (mtGenome). The heavy (H) strand is represented by the outside line and contains a higher number of C-G residues than the light (L) strand. The 37 RNA and protein coding gene regions are abbreviated around the mtGenome next to the strand from which they are synthesized (see Table 10.2). Most forensic mtDNA analyses presently examine only HV1 and HV2 in the non-coding control region or displacement loop shown at the top of the figure. Due to insertions and deletions that exist around the mtGenome in different individuals, it is not 16,569 bp. Figure 10.1, J.M. Butler (2005) Forensic DNA Typing, 2nd Edition © 2005 Elsevier Academic Press
 1/16,569. cyt b. ND5. ND6. ND4. ND4L. ND3. COIII. ATP6. ATP8. COII. 12S. rRNA. 16S. ND1. ND2. COI. OH. 9-bp deletion. OL. F. V. L1. I. Q. M. W. A. N. C. Y. S1. D. K. G. R. H. S2. L2. E. P. T. HV1. HV ,569 bp tRNAs. 2 rRNAs. 13 genes. Heavy (H) strand. Light (L) strand. Figure 10.1 Schematic showing the circular mitochondrial DNA genome (mtGenome). The heavy (H) strand is represented by the outside line and contains a higher number of C-G residues than the light (L) strand. The 37 RNA and protein coding gene regions are abbreviated around the mtGenome next to the strand from which they are synthesized (see Table 10.2). Most forensic mtDNA analyses presently examine only HV1 and HV2 in the non-coding control region or displacement loop shown at the top of the figure. Due to insertions and deletions that exist around the mtGenome in different individuals, it is not 16,569 bp. Figure 10.1, J.M. Butler (2005) Forensic DNA Typing, 2nd Edition © 2005 Elsevier Academic Press.")
53
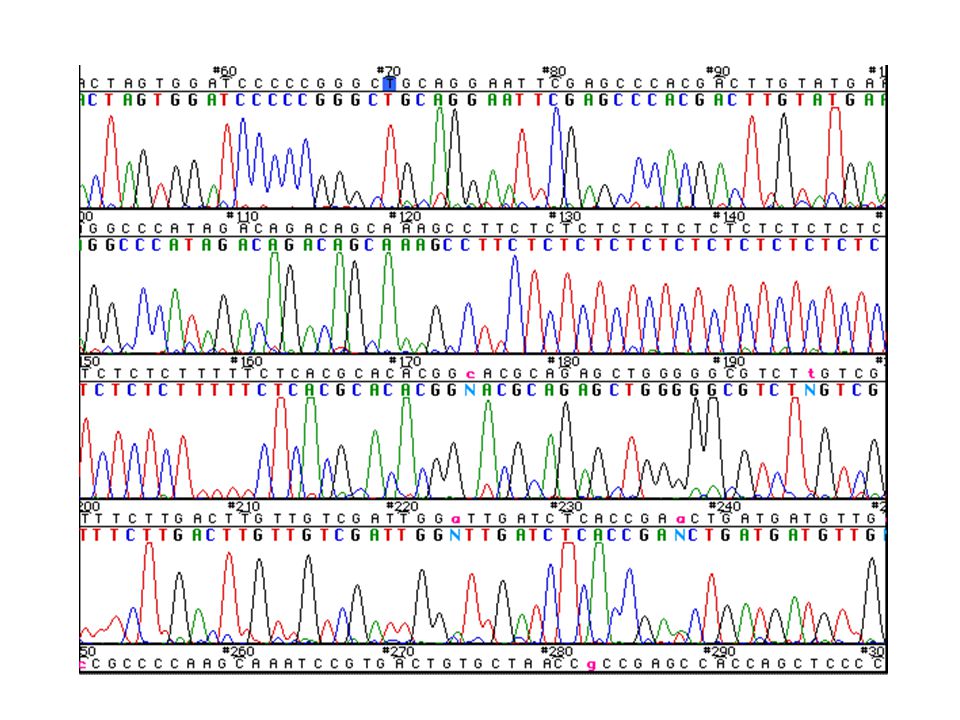
DNA DİZİ ANALİZİ

55
MtDNA Haplotype Groups:
1 2 3 5 4 12 11 10 9 6 7 8 18 17 15 16 13 14 MtDNA Haplotype Groups: 2,3,6,8,11,13,15,16 4,9,10 14,17,18 A B C D E F G Figure 10.2 Illustration of maternal mitochondrial DNA inheritance for 18 individuals in a hypothetical pedigree. Squares represent males and circles females. Each unique mtDNA type is represented by a different letter. Figure 10.2, J.M. Butler (2005) Forensic DNA Typing, 2nd Edition © 2005 Elsevier Academic Press
 Forensic DNA Typing, 2nd Edition © 2005 Elsevier Academic Press.")
56
Multi-Locus Probes ABO blood groups Multiplex STRs
Speed of Analysis (Technology) Power of Discrimination (Genetics) Low High Slow Fast Markers Used (Biology) RFLP Single Locus Probes Multi-Locus Probes ABO blood groups Multiplex STRs DQ single STR D1S80 mtDNA PolyMarker Figure 1.1 Comparison of DNA typing technologies. Forensic DNA markers are arbitrarily plotted in relationship to four quadrants defined by the power of discrimination for the genetic system used and the speed at which the analysis for that marker may be performed. Note that this diagram does not reflect the usefulness of these markers in terms of forensic cases. Figure 1.1, J.M. Butler (2005) Forensic DNA Typing, 2nd Edition © 2005 Elsevier Academic Press
 Power of Discrimination (Genetics) Low. High. Slow. Fast. Markers Used (Biology) RFLP. Single Locus Probes. Multi-Locus Probes. ABO. blood groups. Multiplex STRs. DQ single STR. D1S80. mtDNA. PolyMarker. Figure 1.1 Comparison of DNA typing technologies. Forensic DNA markers are arbitrarily plotted in relationship to four quadrants defined by the power of discrimination for the genetic system used and the speed at which the analysis for that marker may be performed. Note that this diagram does not reflect the usefulness of these markers in terms of forensic cases. Figure 1.1, J.M. Butler (2005) Forensic DNA Typing, 2nd Edition © 2005 Elsevier Academic Press.")
57
(passed on complete, but only by sons)
Lineage Markers Autosomal (passed on in part, from all ancestors) Figure 9.1 Illustration of inheritance patterns from recombining autosomal genetic markers and the lineage markers from the Y-chromosome and mitochondrial DNA. Y-Chromosome (passed on complete, but only by sons) Mitochondrial (passed on complete, but only by daughters) Figure 9.1, J.M. Butler (2005) Forensic DNA Typing, 2nd Edition © 2005 Elsevier Academic Press
 Figure 9.1 Illustration of inheritance patterns from recombining autosomal genetic markers and the lineage markers from the Y-chromosome and mitochondrial DNA. Y-Chromosome. (passed on complete, but only by sons) Mitochondrial. (passed on complete, but only by daughters) Figure 9.1, J.M. Butler (2005) Forensic DNA Typing, 2nd Edition © 2005 Elsevier Academic Press.")
58
Compare Q and K sequences
Performed separately and preferably after evidence is completed Extract mtDNA from reference (K) sample PCR Amplify HV1 and HV2 Regions Sequence HV1 and HV2 Amplicons (both strands) Confirm sequence with forward and reverse strands Note differences from Anderson (reference) sequence Extract mtDNA from evidence (Q) sample PCR Amplify HV1 and HV2 Regions Sequence HV1 and HV2 Amplicons (both strands) Confirm sequence with forward and reverse strands Note differences from Anderson (reference) sequence Figure 10.4 Process for evaluation of mtDNA samples. The evidence or question (Q) sample may come from a crime scene or a mass disaster. The reference or known (K) sample may be a maternal relative or the suspect in a criminal investigation. In a criminal investigation, the victim may also be tested and compared to the Q and K results. Compare Q and K sequences Compare with database to determine haplotype frequency Figure 10.4, J.M. Butler (2005) Forensic DNA Typing, 2nd Edition © 2005 Elsevier Academic Press
 sample. PCR Amplify. HV1 and HV2 Regions. Sequence HV1 and HV2 Amplicons. (both strands) Confirm sequence with forward and reverse strands. Note differences from Anderson (reference) sequence. Extract mtDNA from evidence (Q) sample. PCR Amplify. HV1 and HV2 Regions. Sequence HV1 and HV2 Amplicons. (both strands) Confirm sequence with forward and reverse strands. Note differences from Anderson (reference) sequence. Figure 10.4 Process for evaluation of mtDNA samples. The evidence or question (Q) sample may come from a crime scene or a mass disaster. The reference or known (K) sample may be a maternal relative or the suspect in a criminal investigation. In a criminal investigation, the victim may also be tested and compared to the Q and K results. Compare Q and K sequences. Compare with database to determine haplotype frequency. Figure 10.4, J.M. Butler (2005) Forensic DNA Typing, 2nd Edition © 2005 Elsevier Academic Press.")
59
Hypervariable Region I
GAAAAAGTCT TTAACTCCAC CATTAGCACC CAAAGCTAAG ATTCTAATTT AAACTATTCT CTTTTTCAGA AATTGAGGTG GTAATCGTGG GTTTCGATTC TAAGATTAAA TTTGATAAGA CTGTTCTTTC ATGGGGAAGC AGATTTGGGT ACCACCCAAG TATTGACTCA CCCATCAACA GACAAGAAAG TACCCCTTCG TCTAAACCCA TGGTGGGTTC ATAACTGAGT GGGTAGTTGT C C A ACCGCTATGT ATTTCGTACA TTACTGCCAG CCACCATGAA TATTGTACGG TACCATAAAT TGGCGATACA TAAAGCATGT AATGACGGTC GGTGGTACTT ATAACATGCC ATGGTATTTA ACTTGACCAC CTGTAGTACA TAAAAACCCA ATCCACATCA AAACCCCCTC CCCATGCTTA TGAACTGGTG GACATCATGT ATTTTTGGGT TAGGTGTAGT TTTGGGGGAG GGGTACGAAT CAAGCAAGTA CAGCAATCAA CCCTCAACTA TCACACATCA ACTGCAACTC CAAAGCCACC GTTCGTTCAT GTCGTTAGTT GGGAGTTGAT AGTGTGTAGT TGACGTTGAG GTTTCGGTGG T T C G C CCTCACCCAC TAGGATACCA ACAAACCTAC CCACCCTTAA CAGTACATAG TACATAAAGC GGAGTGGGTG ATCCTATGGT TGTTTGGATG GGTGGGAATT GTCATGTATC ATGTATTTCG C CATTTACCGT ACATAGCACA TTACAGTCAA ATCCCTTCTC GTCCCCATGG ATGACCCCCC GTAAATGGCA TGTATCGTGT AATGTCAGTT TAGGGAAGAG CAGGGGTACC TACTGGGGGG TCAGATAGGG GTCCCTTGAC CACCATCCTC CGTGAAATCA ATATCCCGCA CAAGAGTGCT AGTCTATCCC CAGGGAACTG GTGGTAGGAG GCACTTTAGT TATAGGGCGT GTTCTCACGA FBI A1 (L15997) Roche (F15975) HV1 16093 16126 16129 HVI C-stretch Roche IA Roche ID Roche IC Roche IE FBI B1 (H16391) Roche (R16418) Hypervariable Region I 342 bp examined SSO Probes 16093 16126 16129 16270 16278 16304 16309 16311 16362 Only 9 sites examined Figure 10.6
 Roche (F15975) HV HVI C-stretch. Roche IA. Roche ID. Roche IC. Roche IE. FBI B1 (H16391) Roche (R16418) Hypervariable Region I bp examined. SSO Probes Only 9 sites examined. Figure")
60
(A) mtDNA Sequences Aligned with rCRS (positions 16071-16140)
ACCGCTATGT ATTTCGTACA TTACTGCCAG CCACCATGAA TATTGTACGG TACCATAAAT rCRS ACCGCTATGT ATCTCGTACA TTACTGCCAG CCACCATGAA TATTGTACAG TACCATAAAT Q K (B) Reporting Format with Differences from rCRS Sample Q 16093C 16129A Sample K 16093C 16129A Figure 10.8 (A) Comparison of sequence alignments for hypothetical Q and K samples with (B) conversion to the revised Cambridge Reference Sequence (rCRS) differences for reporting purposes. Figure 10.8, J.M. Butler (2005) Forensic DNA Typing, 2nd Edition © 2005 Elsevier Academic Press
 Reporting Format with Differences from rCRS. Sample Q C A. Sample K C A. Figure 10.8 (A) Comparison of sequence alignments for hypothetical Q and K samples with (B) conversion to the revised Cambridge Reference Sequence (rCRS) differences for reporting purposes. Figure 10.8, J.M. Butler (2005) Forensic DNA Typing, 2nd Edition © 2005 Elsevier Academic Press.")
61
İnsan genomu 3,164,700,000 nukleotidden oluşmaktadır.
Toplam gen sayısı 29,000-36,000 arasındadır. Nükleotid dizilerinin %99’u bütün insanlarda aynıdır.

62
Bu güne kadar insanda 1,5 milyon kadar tek nukleotid değişikliği bölgesi saptanmıştır.
Tanımlanmış genlerin %50’den fazlasının işlevleri henüz bilinmemektedir. Genomun yaklaşık %2’si proteinleri kodlamaktadır. Proteinleri kodlamayan dizi tekrarları, genomun büyük bölümünü oluşturur.

63
İnsan Genomundan Beklentilerimiz
Moleküler Tıp -Tanı yöntemlerinin geliştirilmesi - Hastalıklara genetik yatkınlığın belirlenmesi - Genetik yapıya özgü ilaçlar geliştirilmesi Gen tedavisi yöntemlerinin geliştirilmesi

64
Biyoarkeoloji, Antropoloji ve Tarih
- Değişik toplumların göç yollarının ve akrabalıklarının araştırılması - Y kromozom mutasyonlarının incelenmesiyle erkek dağılımının ve göçlerin araştırılması

65
DNA Tanımlama - Adli tıpta suçluların belirlenmesi - Kan bağlarının saptanması - Organ nakillerinde doku uyumunun kesin şekilde saptanması - Soy ağaçlarının geliştirilmesi

66
Kuşkular Genetik Bilginin Özelliği ve Gizliliği
- Genetik bilgiye kim sahip olacak ve kontrol edecek? - Genetik bilgilerin gizliliği tıbbi gizlilikten farklı mı? Genetik bilginin kullanılması - Bireye ait genetik bilgilere kim ulaşabilecek ve bu bilgileri nasıl kullanacak?

67
SABRINIZ İÇİN TEŞEKKÜRLER

Benzer bir sunumlar

>")


 problemleri (Matching and Assignment problems)>")


 2 3/4 cup * Margarine 1 Spoon * Kadayif.>")


 (Yrd. Doç. Dr. Deniz Dal)>")
