Sunuyu indir
Sunum yükleniyor. Lütfen bekleyiniz

1
SUNAY COŞKUN– Distribution Centers Manager September 2013
Turkiye “Deliver the Nestlé Model while building solid Foundations for the Future” SUNAY COŞKUN– Distribution Centers Manager September 2013

2
SUNAY COŞKUN DCs MANAGER
dC ORGANIZATIONAL CHART SUNAY COŞKUN DCs MANAGER ADANA DC SUPERVISOR GAZİ KOCAKAPLAN ANKARA DC SUPERVISOR MEHMET AKKURT ANTALYA DC SUPERVISOR SÜLEYMAN ERKARA BURSA DC SUPERVISOR SELEN BUĞA İZMİT DC SUPERVISOR FECRETTİN KETEN İZMİR DC SUPERVISOR SERDAL ERDOĞMUŞ SAMANDIRA DC SUPERVISOR ZEKİ AKTAŞ SEFAKÖY DC SUPERVISOR TARKAN ACAR DCs SUPERVISOR TARIK OZER DCs SPECIALIST MERYEM YAVUZ DCs ASISTANT SPECIALIST NURHAN İBRİKÇİ

3
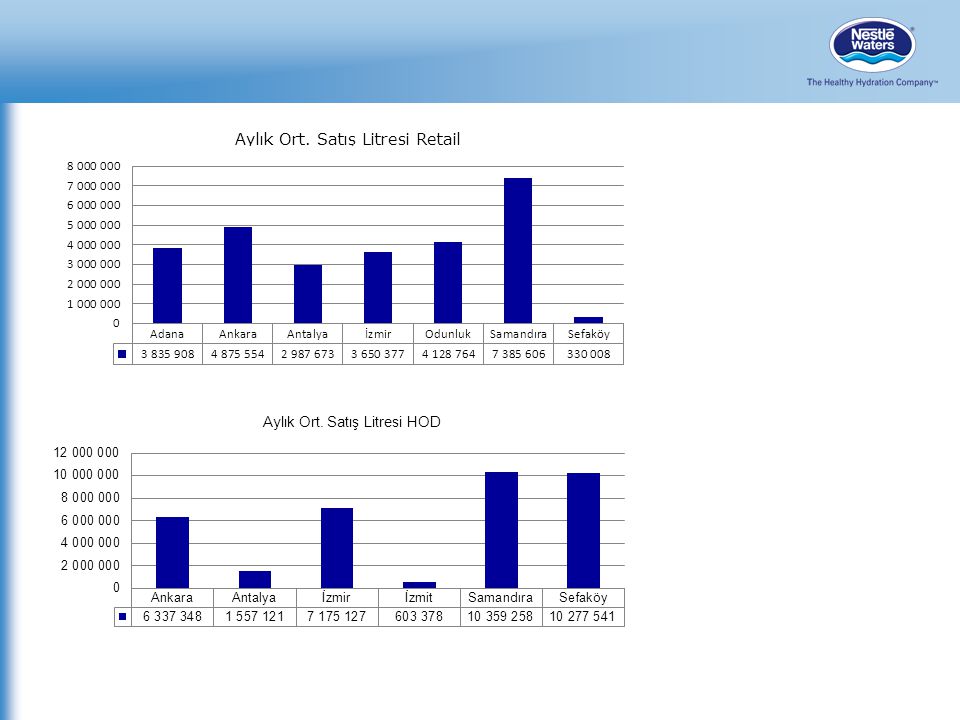
Average Montly Sales (Mio L) % Share in Total DCs HOD Distribution
Ankara Antalya İzmir Konya Bursa Erzurum Balikesir Mugla Sanliurfa Eskisehir Samsun Adana Sivas Istanbul İzmit SEFAKÖY ERİKLİ : Retail & HOD NPL : Retail & HOD ALAÇAM : HOD OTHERS ERİKLİ : Retail &HOD SAMANDIRA. BURSA ERİKLİ: Retail&HOD NPL : Retail & OTHERS İZMİR ANTALYA ERİKLİ: Retail & HOD NPL : Retail & HOD ANKARA İZMİT ERİKLİ: HOD NPL:HOD ALAÇAM:HOD ADANA ERİKLİ: Retail DC Average Montly Sales (Mio L) % Share in Total DCs HOD Distribution HOD PET Ankara 6,3 4,9 17% 18% Adana 3,8 14% Antalya 1,6 3,0 4% 11% İzmir 7,2 3,7 20% 13% Bursa 0,0 4,1 0% 15% Kocaeli 0,6 2% Ist. Anatolian DC 10,4 7,4 29% 27% Ist. European DC 10,3 0,3 28% 1% Around 30% of the total Retail sales and 65% of the HOD sales done through DCs. Total daily distribution for the DCs are around 1 mio L. for Retail and 1,4 mio L for HOD segment.
 % Share in Total DCs HOD Distribution. HOD. PET. Ankara. 6,3. 4,9. 17% 18% Adana. 3,8. 14% Antalya. 1,6. 3,0. 4% 11% İzmir. 7,2. 3,7. 20% 13% Bursa. 0,0. 4,1. 0% 15% Kocaeli. 0,6. 2% Ist. Anatolian DC. 10,4. 7,4. 29% 27% Ist. European DC. 10,3. 0,3. 28% 1% Around 30% of the total Retail sales and 65% of the HOD sales done through DCs. Total daily distribution for the DCs are around 1 mio L. for Retail and 1,4 mio L for HOD segment.")
4
Flawless Operation in Supply Chain 2013
Ankara DC İzmir DC Bursa DC Antalya DC Adana DC İst – Asia DC DSD in 6 biggest cities of TR Import products Sparkling& Soda Ice Tea Beypazarı (No:1) Kızılay (No:2) Fruit Juice Our Fleet
 Kızılay (No:2) Fruit Juice. Our Fleet.")
5
Distribution Centers ( 8 ) are important part of our operation , serving to DSD ( 6 )
Ankara Antalya İzmir Konya Bursa Erzurum Balikesir Mugla Sanliurfa Eskisehir Samsun Adana Sivas Istanbul İzmit Around 30% of the total Retail sales and 65% of the HOD sales done through DCs. Total daily distribution for the DCs are around 1 mio L. for Retail and 1,4 mio L for HOD segment. DC Average Montly Sales (Mio L) 2013 % Share in Total DCs HOD Distribution HOD PET Ankara 6,3 4,9 17% 18% Adana 3,8 14% Antalya 1,6 3,0 4% 11% İzmir 7,2 3,7 20% 13% Bursa 0,0 4,1 0% 15% Kocaeli 0,6 2% Ist. Anatolian DC 10,4 7,4 29% 27% Ist. European DC 10,3 0,3 28% 1% The biggest DC is İstanbul Anatolian DC for both Retail anf HOD
 % Share in Total DCs HOD Distribution. HOD. PET. Ankara. 6,3. 4,9. 17% 18% Adana. 3,8. 14% Antalya. 1,6. 3,0. 4% 11% İzmir. 7,2. 3,7. 20% 13% Bursa. 0,0. 4,1. 0% 15% Kocaeli. 0,6. 2% Ist. Anatolian DC. 10,4. 7,4. 29% 27% Ist. European DC. 10,3. 0,3. 28% 1% The biggest DC is İstanbul Anatolian DC for both Retail anf HOD.")
6
Distribution Trucks & Vans & Others ( 604 )
Average Daily Km Driven By the HOD Trucks with 3,6 tons of average daily fuel oil consumption Around 280 trips done daily to costumers by the distribution trucks in the DCs

7
DC WAREHOUSES (RENTED)
Warehouse Capacities 2013 DC WAREHOUSES (RENTED) DC GROSS SIZE (M2) AREA USED FOR STORAGE (M2) RETAIL/ HOD STORAGE CAPACITY (PALLETS) # Of DISTRIBUTION VEHICLES ADANA 3100 1350 RETAIL 700 7 ANKARA 11000 2000 24 6000 HOD 1340 11 ANTALYA 9.820 3.842 1800 15 200 4 IZMIR 4.110 4.300 1000 17 775 10 IZMIT 180 140 80 1 BURSA 2.300 1.344 550 21 SAMANDIRA 9.550 6.074 1650 29 1.200 14 SEFAKÖY 4.200 2.000 175 670 16
 DC. GROSS SIZE (M2) AREA USED FOR STORAGE (M2) RETAIL/ HOD. STORAGE CAPACITY (PALLETS) # Of DISTRIBUTION VEHICLES. ADANA RETAIL ANKARA HOD ANTALYA IZMIR IZMIT BURSA SAMANDIRA SEFAKÖY")
8
Realized Improvement Projects in SC ( cont’d )
High Capacity Trucks Rut Optimization on (Retail and HOD) Ürünler arası kontraplak koyulması Perdeli lift kullanımı Dingil ekleme
 Ürünler arası kontraplak koyulması. Perdeli lift kullanımı. Dingil ekleme.")
9
Safety Initiatives in Supply Chain
The aim is to provide good house-keeping in DCs areas

10
Safety Initiatives in Supply Chain ( cont’d )
Use of “Orange Cone” Use of 4 flashing lights when parked Use of “Orange Cone” Use of 4 flashing lights when parked We are continuesly working on to improve and implement good safety practices and increase safety awareness on our operations.

11
In the first eight months of 2013 includes data on.
1-The reason for the be high rate of one operation of the vehicle in Izmit and welded to the low sales volume. With the increase of in productivity the sale will increase. 2- More than in 2014 order to increase productivity to reduce expedition the order is to increase number of customers in a vehicle. Will be coordination with Sales Team.

12
In the first eight months of 2013 includes data on.
1- Distribution is one of the issues that are the biggest influence on cost plus. To reduce costs and increase the efficiency of the installation the vehicle less than the number of customers, the sales volume must be high. Our target is to provide the development of this in coordination with the sales team. This data Aim at reducing km least 10-15% between .

13
In the first eight months of 2013 includes data on.
Maliyetlerimizin önemli gider kalemlerinden biri de akaryakıt giderleridir. Ne kadar kısa mesafede dağıtım gerçekleştirirsek o derece de dağıtım maliyetleri düşecektir. Hedefimiz satış ekibimiz ile koordineli bu gelişimi sağlamaktır. Bu verileri en az %10-15 arasında km aşağıya çekebilmeyi hedefliyoruz.

16
Safe Driving, Please THANK YOU

Benzer bir sunumlar


 TURKISH COMMERCIAL.>")

Gelecekte bir eylemi ne kadar zamandır yapıyor olacağımızı ifade eder By next year,>")


